
- Documentation
- Getting Started
- JArchitect Analysis
- JArchitect Plugin for Sonar
- Code Rule and Query
- JArchitect Features
- Build Process Integration
- Code Metrics Definitions
- Code Coverage FAQ
- Trend Monitoring
Dependency Structure Matrix
Introduction
The DSM (Dependency Structure Matrix) is a compact way to represent and navigate across dependencies between components. For most engineers, talking of dependencies means talking about something that looks like that:
DSM is used to represent the same information than a graph.
- Matrix headers’ elements represent graph boxes
- Matrix non-empty cells correspond to graph arrows.
Why using two different ways, graph and DSM, to represent the same information? Because there is a trade-off:
- Graph is more intuitive but can be totally not understandable when the numbers of nodes and edges grow (a few dozens boxes can be enough to produce a graph too complex)
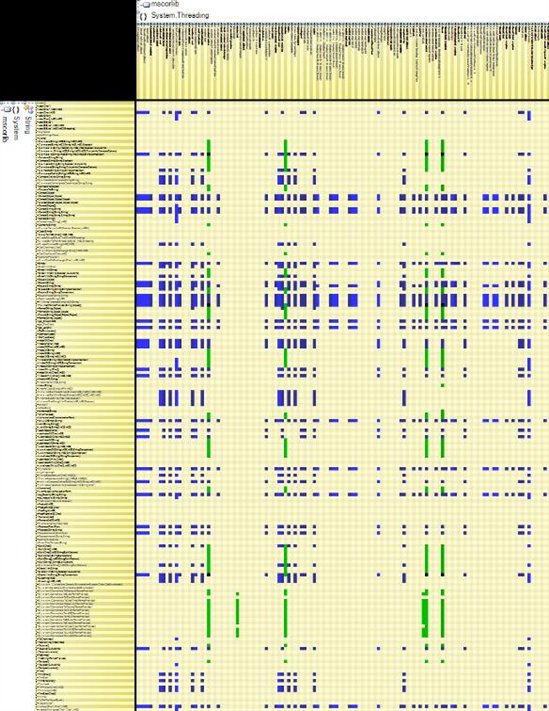
- DSM is less intuitive but can be very efficient to represent large and complex graph. We say that DSM scales compare to graph.
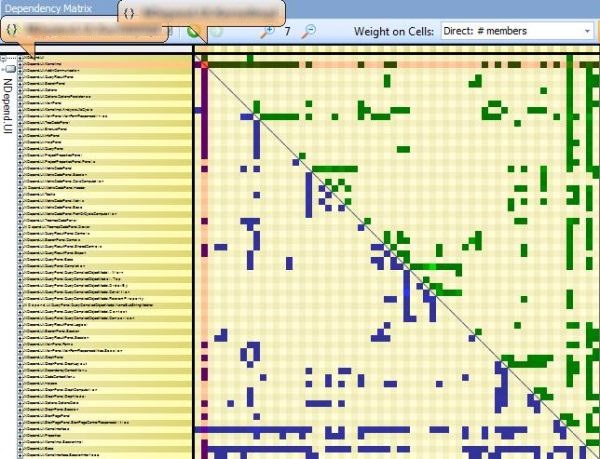
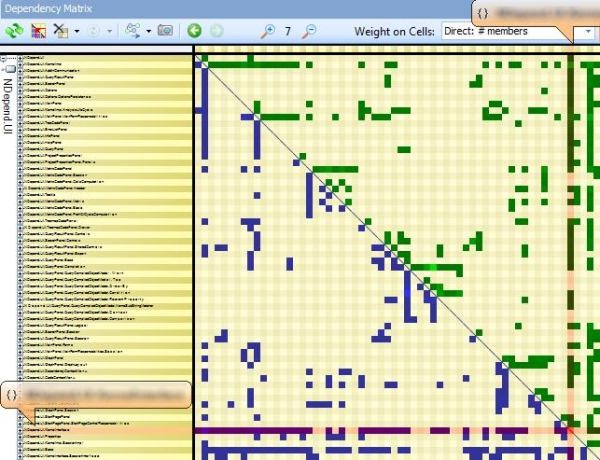
JArchitect offers Context-Sensitive Help to educate the user about what he sees on DSM. JArchitect's DSM relies on a simple 3 coloring scheme for DSM cell: Blue, Green and Black. When hovering a row or a column with the mouse, the Context-Sensitive Help explains the meaning of this coloring scheme:
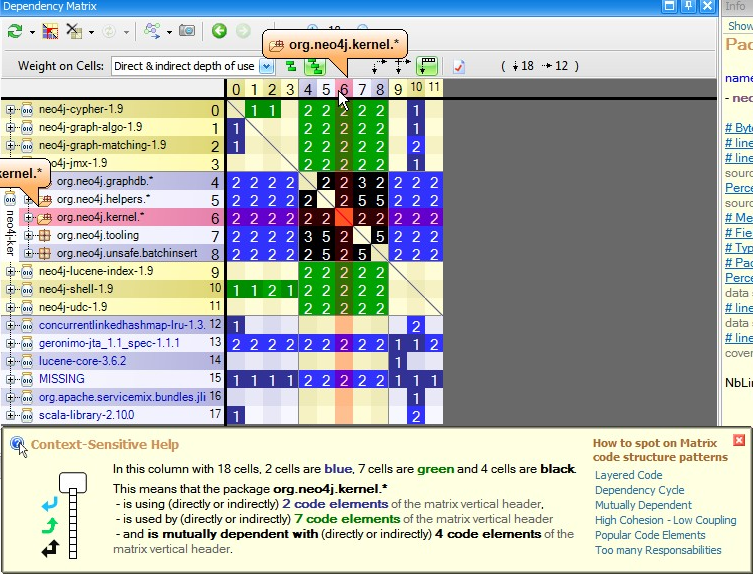
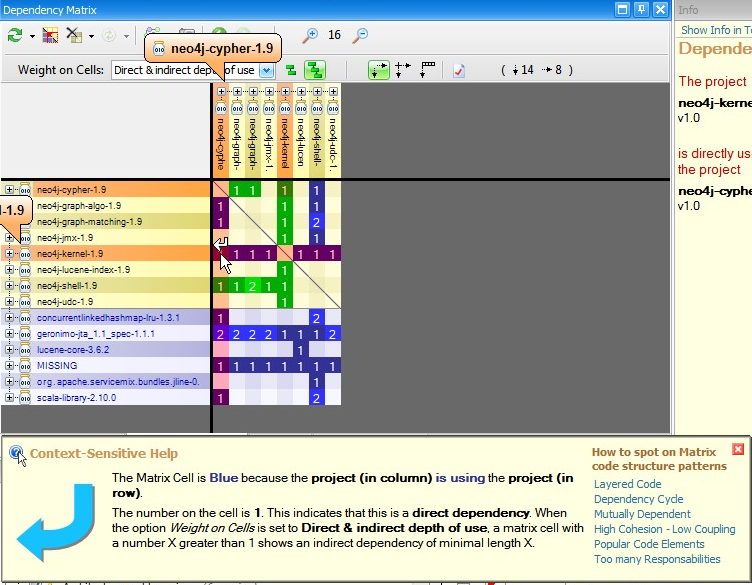
A non-empty DSM Cell contain a number. This number represent the strengths of the coupling represented by the cell. The coupling strength can be expressed in terms of number of members/methods/fields/types or packages involved in the coupling, depending on the actual value of the option Weight on Cells. In addition to the Context-Sensitive Help, the DSM offers as well a Info Panel that explains coupling with a plain-english description:
JArchitect's DSM comes with numerous options to try:
- It has numerous facilities to dig into dependency exploration (a parent column/row can be opened, cells can be expanded...)
- It can deal with squared symmetric DSM and rectangular non-symmetric DSM
- Horizontal and Vertical headers can be bound, to constantly have a squared symmetric matrix
- It comes with the option Indirect usage, where cell shows direct and indirect usage
- The vertical header can contains tier code elements
Identify Code Structure Patterns on Matrix
As explained in the introduction, DSM comes with the particularity to offer easy identification of popular Code Structure Patterns. Let's present most common scenarios:
-
Layered Code
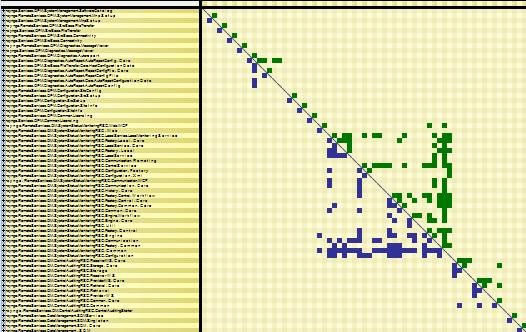
One pattern that is made obvious by a DSM is layered structure (i.e acyclic structure). When the matrix is triangular, with all blue cells in the lower-left triangle and all green cells in the upper-right triangle, then it shows that the structure is perfectly layered. In other words, the structure doesn’t contain any dependency cycle.
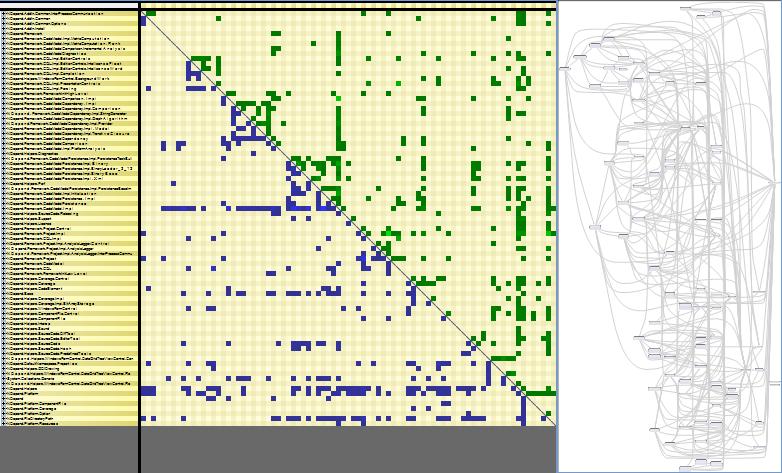
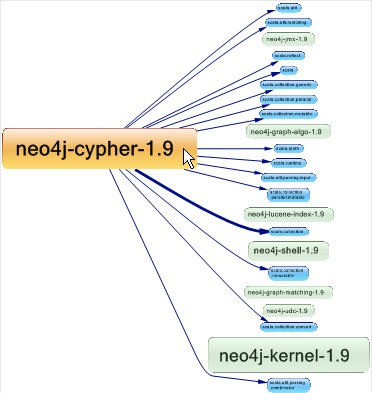
On the right part of the snapshot, the same layered structure is represented with a graph. All arrows have the same left to right direction. The problem with graph, is that the graph layout doesn’t scale. Here, we can barely see the big picture of the structure. If the number of boxes would be multiplied by 2, the graph would be completely un-readable. On the other side, the DSM representation wouldn’t be affected; we say that DSM scales better than graph.
Side note: Interestingly enough, most of graph layout algorithms rely on the fact that a graph is acyclic. To compute layout of a graph with cycles, these algorithms temporarily discard some dependencies to deal with a layered graph, and then append the discarded dependencies at the last step of the computation.
Dependency Cycle
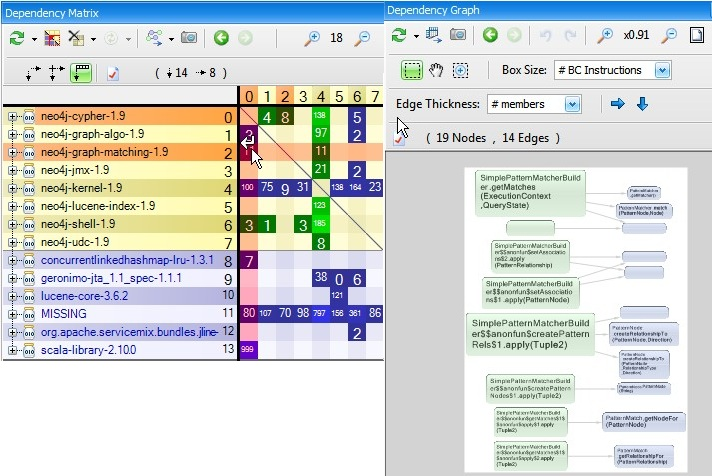
If a structure contains a cycle, the cycle is displayed by a red square on the DSM. We can see that inside the red square, green and blue cells are mixed across the diagonal. There are also some black cells that represent mutual direct usage (i.e A is using B and B is using A).
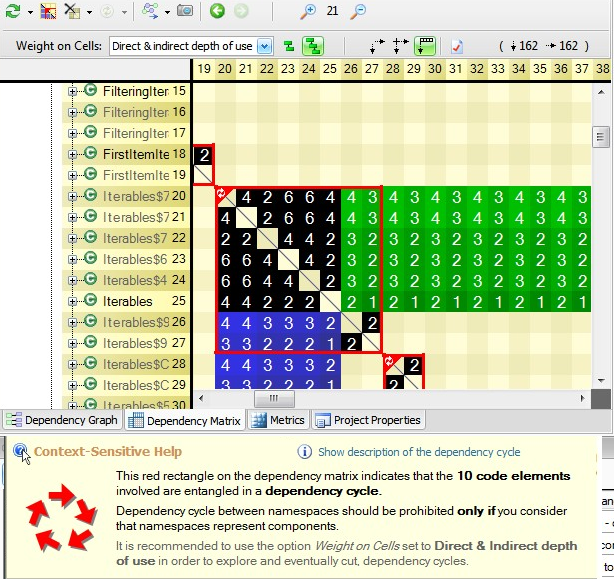
The JArchitect’s DSM comes with the unique option Indirect Dependency. An indirect dependency between A and B means that A is using something, that is using something, that is using something … that is using B. Below is shown the same DSM with a cycle but in indirect mode. We can see that the red square is filled up with only black cells. It just means that given any element A and B in the cycle, A and B are indirectly and mutually dependent.

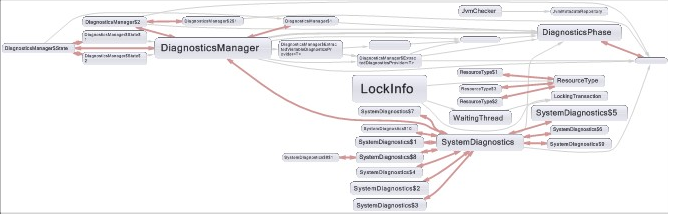
Here is the same structure represented with a graph. The red arrow shows that several elements are mutually dependent. But the graph is not of any help to highlight all elements involved in the parent cycle.
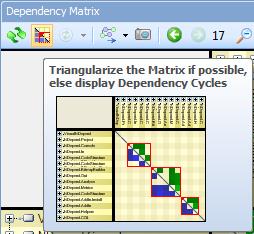
Notice that in JArchitect, we provided a button to highlight cycles in the DSM (if any). If the structure is layered, then this button has for effect to triangularize the matrix and to keep non-empty cells as closed as possible to the diagonal.
High Cohesion - Low Coupling
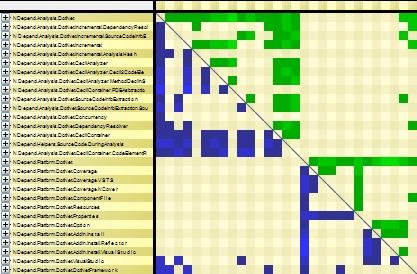
The idea of high-cohesion (inside a component) / low-coupling (between components) is popular nowadays. But if one cannot measure and visualize dependencies, it is hard to get a concrete evaluation of cohesion and coupling. DSM is good at showing high cohesion. In the DSM below, an obvious squared aggregate around the diagonal is displayed. It means that elements involved in the square have a high cohesion: they are strongly dependent on each other although. Moreover, we can see that they are layered since there is no cycle. They are certainly candidate to be grouped into a parent artifact.
On the other hand, the fact that most cells around the square are empty advocate for low-coupling between elements of the square and other elements.
In the DSM below, we can see 2 components with high cohesion (upper and lower square) and a pretty low coupling between them.
While refactoring, having such an indicator can be pretty useful to know if there are opportunities to split coarse components into several more fine-grained components.
Too Many Responsibilities
The Single Responsibility Principle (SRP) is getting popular amongst software architects community nowadays. The principle states that: a class shouldn’t have more than one reason to change. Another way to interpret the SRP is that a class shouldn’t use too many different other types. If we extend the idea at other level, certainly, if a code element is using dozens of other different code elements (at same level), it has too many responsibilities. Often the term God class or God component is used to qualify such piece of code.
DSM can help pinpoint code elements with too many responsibilities. Such code element is represented by columns with many blue cells and by rows with many green cells. The DSM below exposes this phenomenon.
Popular Code Elements
A popular code element is used by many other code elements. Popular code elements are unavoidable (think of the String class for example) but a popular code element is not a flaw. It just means that in every code base, there are some central concepts represented with popular classes
A popular code element is represented by columns with many green cells and by rows with many blue cells. The DSM below highlights a popular code element.
Something to notice is that when one is keeping its code structure perfectly layered, popular components are naturally kept at low-level. Indeed, a popular component cannot de-facto use many things, because popular component are low-level, they cannot use something at a higher level. This would create a dependency from low-level to high-level and this would break the acyclic property of the structure.
Mutually Dependent
You can see the coupling between 2 components by right clicking a non-empty cell, and select the menu Open this dependency.
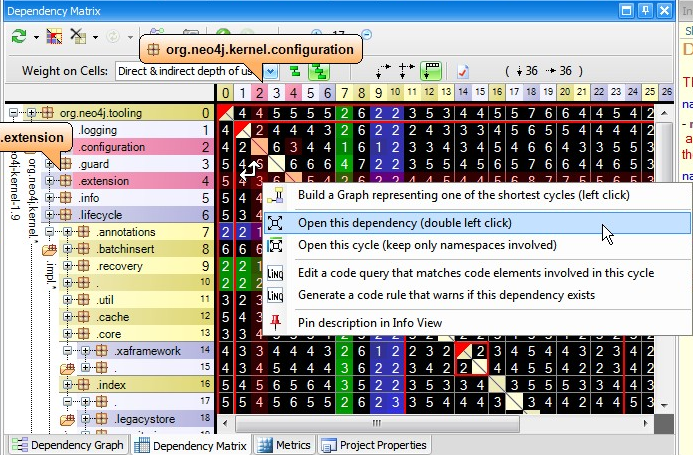
If the opened cell was black as in the snapshot above (i.e if A and B are mutually dependent) then the resulting rectangular matrix will contains both green and blue cells (and eventually black cells as well) as in the snapshot below.
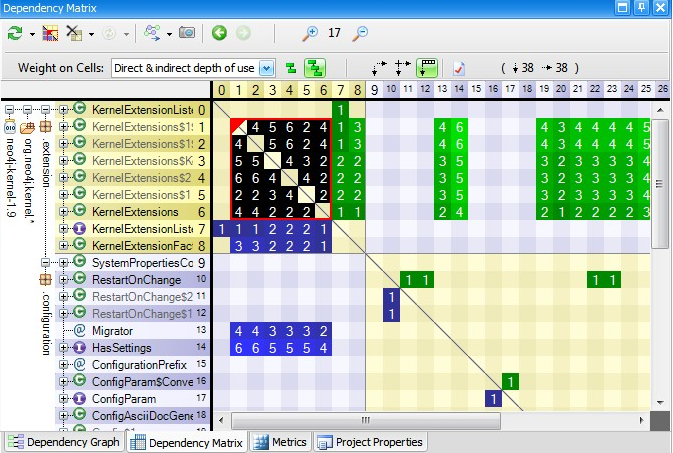
In this situation, you’ll often notice a deficit of green or blue cells (3 blue cells for 1 green cell here). It is because even if 2 code elements are mutually dependent, there often exists a natural level order between them.
Related Resources
- DsmWeb.org
- Design Structure Matrix Methods and Applications (Book) Steven D. Eppinger and Tyson R. Browning